As expected, NIMs are still squeezing as deposits costs continue to rise quicker than loan yields. The same chart from Q4’23, but with more data from Q1’24…

CRE cracks are showing but data points specifically to large banks losing large CRE deals and the worst may be over? If the worry was systemic losses across all office sizes, that’s not what’s unfolding. It looks like the large skyscraper offices in cities where workers have successfully fought back against return to office plans, are the biggest source of failing credits…

If banks thought this problem was going to get worse, we’d expect credit loss provisions to increase, in essence to pad for more pain. But that’s not the case, credit loss provisions are higher than average but have declined QoQ…

The next chart indicates to me the banking sector as a whole is signaling the losses in CRE are manageable. It shows that noncurrent loans and leases is increasing, and allowance for credit losses is increasing too BUT at a slower pace than noncurrent loans and leases. This is causing the Reserve Ratio to decline, although it remains historically high. So the options available are:
- Banks see this as acceptable because the assumption of future or continuing losses is low and they are correct
- OR Banks see this as acceptable for the same reason as above, but they are wrong and the CRE deterioration metrics will get materially worse.

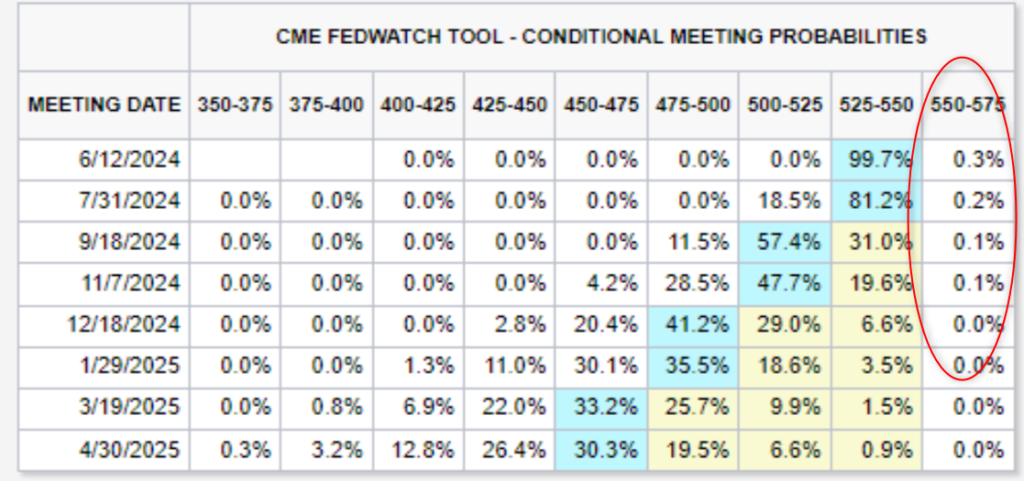
And finally a follow up to a previous post around the % chances rates rise is > than 0. It looks like the CME group briefly started tracking it, so maybe I was off and it comes into play every so often..
