Marty Gruenberg and team released their Q2 ’23 Quarterly Banking Profile on 9/7 and given these reports provide dated analysis, I was unable to find anything surprising. What’s worth diving into is the forces behind shrinking loan growth across the industry. See below:
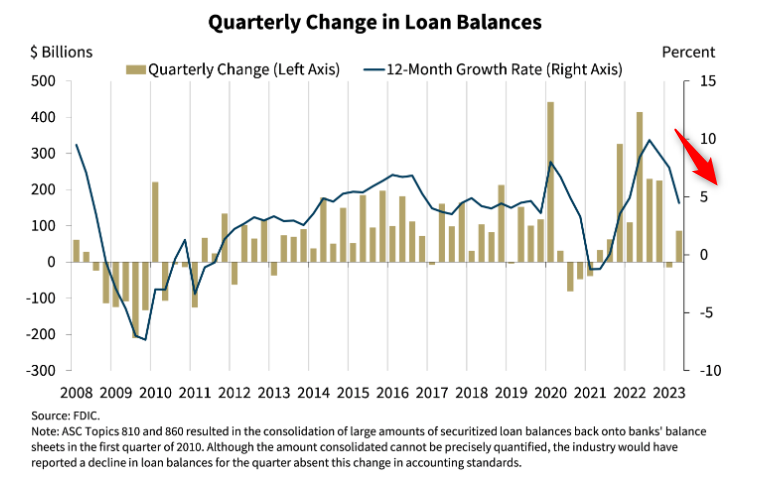
As mentioned in the notes of this chart, year over year growth is around the average of the last ~10 years @ 4.5%… but velocity and direction are important here. Many banks are experiencing stressed loan to deposit ratios, and that’s driving intentional reduction in loan growth as funding costs, both in the form of higher deposit rates or even funding through the Bank Term Funding Program, are so high. This means further compressing of already historically compressed NIMs. To me this represents the banking ‘Supply’ side of the formula.
But it gets better, it appears the ‘Demand’ side is shrinking too…
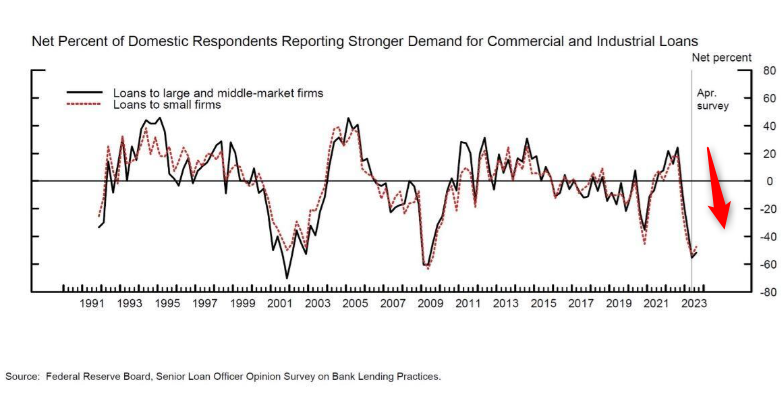
Both of these forces are complimenting each other. Where does the industry go from here?
For banks that are unable to stabilize their loan to deposit ratios, or sustain an extended period of decreasing NIM’s, I’m afraid the answer is increased consolidation between banks that cant afford to fund outstandings and ones that can.