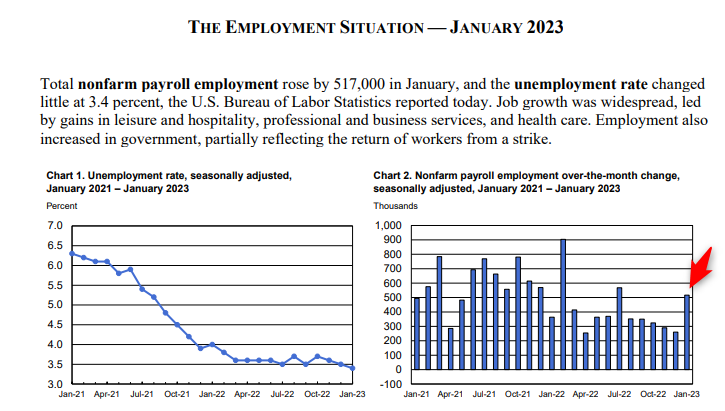
The January jobs number garnered a lot of attention given it smashed estimates to the upside (187k estimated vs 517 actual ?). True to form, both bulls and bears are trying to make the case this number supports their expectations of the market looking forward. Lucky for us the Bureau of Labor Statistics breaks down the number for us to infer on our own with the data.
I prefer to lean on the Establishment Survey Data (jobs broken down by industry):
- Leisure and hospitality – 128k (99k in food services)
- Professional and biz services – 82k
- Government – 74k (35k of which returned from strike*)
- Heath care – 58K
- Retail Trade – 30k
- Construction – 25k (I’m surprised to see this continue to gain given sustained interest rates… likely need to pair this number with construction lending #’s)
- Transportation and warehousing – 23k (in line with averages from ’22)
- Social assistance – 21k
- Manufacturing – 19k
- Little change attributed to: mining, quarrying, and oil and gas extraction; wholesale trade; information; financial activities; and other services
I’ve heard a theory that what many of these numbers mean (food services, professional and biz services, and health care) are hiring more workers to alleviate long hours by less workers in the past. However the average workweek for all employees on private nonfarm payrolls rose by .03 hours, vs falling to support the theory, to 34.7 hours in January. We likely need another month or two for this average workweek number to drop as new workers are onboarded (if alleviating long hours is indeed the driver here).